largest U.S. trade partners

Are you ready to discover where American businesses make their biggest deals? Whether you’re planning your next export venture or seeking reliable import sources, understanding the United States’ trade landscape can unlock millions in potential revenue for your company. Maybe you’re searching for the best possible way to obtain U.S. import license?

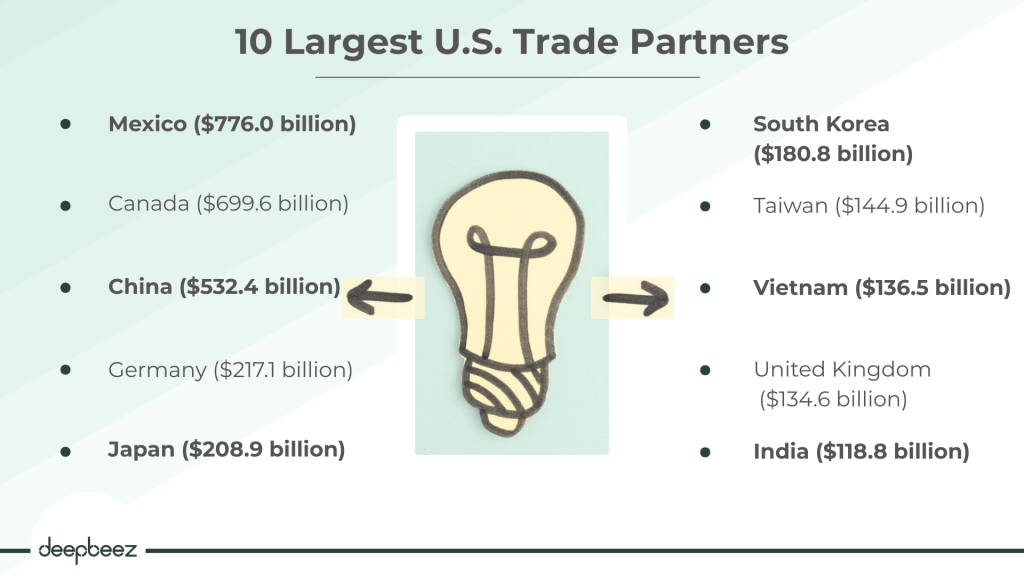
The biggest U.S. trading partners are:

  • Mexico ($776.0 billion)
  • Canada ($699.6 billion)
  • China ($532.4 billion)
  • Germany ($217.1 billion)
  • Japan ($208.9 billion)
  • South Korea ($180.8 billion)
  • Taiwan ($144.9 billion)
  • Vietnam ($136.5 billion)
  • United Kingdom ($134.6 billion)
  • India ($118.8 billion)

The numbers tell an incredible story. The United States trades with more than 200 countries and territories worldwide, cementing its position as the world’s largest trading nation. But here’s what every smart business owner asks: Which markets truly matter for your bottom line?

The Top 10 Largest U.S. Trading Partners (2025)

Think about this for a moment: if you could choose just 10 countries to focus your trade efforts on, which ones would give you access to nearly two-thirds of all U.S. trade volume?

Discover more: U.S. Export License

The answer might surprise you. Through November 2024, just 10 countries captured an astounding 64.5% of total U.S. trade.

RankCountryTrade VolumePercentage of Total TradeKey Export Sectors
1Mexico$776.0 billion15.9%Electronics, vehicles, agriculture, machinery
2Canada$699.6 billion14.3%Aerospace, automotive, renewable energy, IT
3China$532.4 billion10.9%Various sectors (complex relationship)
4Germany$217.1 billion4.4%Cybersecurity, green technologies, healthcare
5Japan$208.9 billion4.3%Natural gas, pharmaceuticals, industrial machines
6South Korea$180.8 billion3.7%Aerospace, defense, ICT, medical equipment
7Taiwan$144.9 billion3.0%Commercial drones, energy equipment, medical devices
8Vietnam$136.5 billion2.8%Telecommunications, IT, power generation
9United Kingdom$134.6 billion2.8%Aerospace, defense, FinTech, medical technology
10India$118.8 billion2.4%Civil aviation, defense, healthcare, ICT

Notice something fascinating here? Mexico and Canada dominate the top spots, accounting for over 30% of all U.S. trade combined. This proximity advantage creates natural opportunities for faster shipping, lower costs, and stronger business relationships.

Who Are U.S. Main Export Partners? (March 2025)

Now, let’s get specific about exports. If you’re selling American products abroad, you need to know where your competitors find their biggest successes. The March 2025 data reveals some eye-opening patterns.

RankCountryExport ValuePercentage of Total Exports
1Canada$31.8 billion16.6%
2Mexico$29.4 billion15.4%
3China$11.5 billion6.0%
4United Kingdom$8.7 billion4.6%
5Netherlands$8.5 billion4.5%
6Germany$8.1 billion4.3%
7Japan$7.3 billion3.8%
8South Korea$5.8 billion3.0%
9Brazil$4.7 billion2.4%
10Taiwan$4.6 billion2.4%
11France$4.3 billion2.3%
12Switzerland$4.2 billion2.2%
13India$3.8 billion2.0%
14Singapore$3.5 billion1.8%
15Belgium$3.4 billion1.8%

Here’s a question for you: Are you maximizing your potential in these top markets? The top 15 export destinations captured 73.1% of all U.S. exports in March 2025. If your export strategy doesn’t include at least half of these countries, you might be leaving serious money on the table.

The Best Export Strategy for Your Business

Consider this scenario: You manufacture medical devices and you’re debating between expanding into European or Asian markets. The data shows Germany importing $8.1 billion worth of U.S. goods monthly, with healthcare and medical devices as leading sectors. Meanwhile, South Korea imported $5.8 billion, also with medical equipment as a key category.

Both markets welcome American medical technology, but Germany’s larger trade volume suggests deeper market penetration and potentially more established distribution networks. This kind of intelligence helps you allocate your marketing budget more effectively.

Who Are U.S. Main Import Partners? (March 2025)

If you’re in the import business, understanding America’s primary suppliers gives you insights into competitive dynamics, pricing trends, and potential partnership opportunities.

RankCountryImport ValuePercentage of Total Imports
1Mexico$48.0 billion14.0%
2Canada$35.7 billion10.4%
3Ireland$30.7 billion9.0%
4China$29.4 billion8.6%
5Switzerland$18.6 billion5.4%
6Germany$15.7 billion4.6%
7Vietnam$14.8 billion4.3%
8Japan$13.5 billion3.9%
9Taiwan$12.4 billion3.6%
10South Korea$12.1 billion3.5%
11India$11.2 billion3.3%
12France$7.8 billion2.3%
13Italy$7.2 billion2.1%
14Thailand$7.1 billion2.1%
15United Kingdom$7.0 billion2.1%

Did Ireland’s third-place ranking catch you off guard? Many traders overlook this dynamic. Ireland’s massive $30.7 billion in monthly exports to the U.S. often involves technology, pharmaceuticals, and financial services – sectors where they’ve built incredible expertise.

Total Trade Volume Leaders (March 2025)

Let’s examine the most current data to understand how trade patterns evolved. In March 2025 alone, total U.S. trade reached $533.6 billion, with these countries leading the charge:

2025 : U.S. trade in goods with Mexico

NOTE: All figures are in millions of U.S. dollars on a nominal basis, not seasonally adjusted unless otherwise specified. Details may not equal totals due to rounding. Table reflects only those months for which there was trade.

MonthExportsImportsBalance
January 202527,929.541,678.6-13,749.1
February 202526,753.641,638.7-14,885.2
March 202529,362.447,981.8-18,619.4
TOTAL 202584,045.5131,299.2-47,253.6

2025 : U.S. trade in goods with Canada

MonthExportsImportsBalance
January 202527,334.638,338.5-11,003.9
February 202528,261.934,924.7-6,662.8
March 202531,790.235,667.6-3,877.4
TOTAL 202587,386.7108,930.8-21,544.1

2025 : U.S. trade in goods with China

January 20259,901.341,639.2-31,737.8
February 202510,461.631,635.4-21,173.8
March 202511,458.229,383.7-17,925.5
TOTAL 202531,821.1102,658.2-70,837.1

2025 : U.S. trade in goods with Ireland

January 20251,247.613,637.2-12,389.6
February 20251,279.915,273.7-13,993.8
March 20251,401.430,726.4-29,325.0
TOTAL 20253,928.959,637.2-55,708.4

2025 : U.S. trade in goods with Germany

January 20256,093.813,659.2-7,565.4
February 20255,967.412,679.4-6,712.0
March 20258,129.415,654.4-7,524.9
TOTAL 202520,190.741,993.0-21,802.3

Mexico and Canada’s dominance isn’t accidental. The strong trade relationships built through NAFTA (now USMCA) create natural advantages:

  • Reduced tariffs and trade barriers
  • Geographic proximity reducing shipping costs
  • Established supply chain networks
  • Cultural and business familiarity

FAQ

  1. Who are the United States’ biggest trade partners in 2025?
    Mexico
    is currently the largest trading partner of the United States, followed by Canada and China. Mexico accounts for nearly 16% of America’s total trade, Canada 14%, and China 11%. These three countries together represent more than 40% of all U.S. international trade. The shift to Mexico as the top partner reflects changing supply chains and nearshoring trends.
  2. When did Mexico become the U.S.’s largest trading partner?
    Mexico officially became the United States’ largest trading partner in 2023, marking a significant shift from China’s long-standing dominance. This change was driven by companies diversifying production away from China due to geopolitical tensions and the push for nearshoring manufacturing closer to North America.
  3. What is the USMCA and how does it affect trade?
    The United States-Mexico-Canada Agreement (USMCA) entered into force on July 1, 2020, replacing NAFTA. U.S. goods and services trade with USMCA countries totaled an estimated $1.8 trillion in 2022. The agreement includes updated rules for automotive trade, stronger labor protections, and new provisions for digital trade and environmental standards.
  4. Why does the U.S. have a trade deficit with most countries?
    Overall, U.S. trade deficits are driven primarily by imports of goods, which include everything from raw materials to finished products to foodstuffs. The country’s $1.2 trillion trade deficit in goods far outweighs its $295.2 billion trade surplus in services. The U.S. economy’s high consumption levels and the dollar’s status as the global reserve currency contribute to this pattern.
  5. What are the largest trade deficits the U.S. has?
    In 2024, the U.S. imported $462.5 billion in goods and services from China and exported $199.2 billion, resulting in a $263.3 billion trade deficit. The U.S.-Mexico trade deficit last year was $179.0 billion. The U.S. trade deficit with Canada, while still large at $35.7 billion, was much smaller.
  6. Do tariffs actually reduce trade deficits?
    Economists say that data show “tariffs have little direct impact on deficits.” Higher tariffs lead to both reduced imports and exports, as well as less total income. A January 2024 International Monetary Fund paper found that unexpected tariff shocks tend to reduce imports more than exports, leading to slight decreases in the trade deficit at the expense of persistent gross domestic product losses.
  7. How do Americans view trade with China, Mexico, and Canada?
    Americans are most skeptical about U.S. trade with China: 10% say it benefits the U.S. more than China, while 46% take the opposite view. When asked about trade with Mexico, 16% of Americans say it benefits the U.S. more than Mexico, while 29% say the reverse. For trade between the U.S. and Canada, 10% say it benefits the U.S. more than Canada, while 26% say Canada benefits more.
  8. What goods does the U.S. import the most?
    The U.S. imports a wide variety of goods including electronics and machinery from China, automobiles and auto parts from Mexico and Canada, energy products like oil from Canada, and agricultural products from various partners. Canada supplies more than half of America’s imported crude oil.
  9. What are the U.S.’s main exports?
    The United States is the 2nd largest goods exporter in the world, behind only China. U.S. goods exports to the world totaled $2.1 trillion in 2022. Major exports include refined petroleum, agricultural products (especially soybeans and corn), aircraft, machinery, and services like financial and professional services.
  10. Why is China such a controversial trade partner?
    President Donald Trump’s trade war with China that began in his first administration has snowballed into greater tensions between the world’s biggest economies. Issues include allegations of unfair trade practices, intellectual property theft, government subsidies, and concerns about manufacturing job losses. Studies found that U.S. companies primarily bore the cost of the tariffs.
  11. How important is Canada as a trade partner?
    Canada is consistently among the top 3 U.S. trade partners and is particularly important for energy security. Canada was the largest purchaser of U.S. goods exports in 2022, accounting for 17.3 percent of total U.S. goods exports. The two countries have deeply integrated supply chains, especially in automotive manufacturing and energy.
  12. What happens if the U.S. withdraws from USMCA?
    An unsuccessful review would inject uncertainty into North American trade and investment relations, potentially disrupting economic growth and integration gains made over the last 30 years. Mexico and Canada are now the U.S.’s first and second trade partners. The three countries produce many manufactured goods together, above all automobiles and auto parts, which would increase in price.
  13. Are trade deficits actually bad for the economy?
    Many economists say the overall trade deficit is not itself a problem for the U.S. economy. That’s because a larger trade deficit can be the result of a stronger economy, as consumers spend and import more while higher interest rates make foreign investors more eager to place their money in the United States.
  14. How do global supply chains affect trade relationships?
    In a world of global supply chains, boosting exports means upping imports as well. Modern manufacturing often involves components and materials crossing borders multiple times before final assembly, making trade relationships more complex than simple bilateral exchanges.
  15. What role do services play in U.S. trade?
    The United States is the largest services exporter in the world. In 2022, U.S. exports of services were $926.0 billion. Services exports include financial services, professional services, technology, entertainment, and tourism. The U.S. typically runs a services trade surplus even when it has a goods trade deficit.
  16. How has nearshoring affected U.S. trade patterns?
    Trade Diversification: U.S. importers are increasingly sourcing from countries like Vietnam and India to mitigate tariff impacts. Supply Chain Adjustments: Companies are reevaluating supply chains, shifting towards nearshoring and friend shoring strategies. This has benefited Mexico and other closer partners at the expense of more distant suppliers.
  17. What are reciprocal tariffs and do they make economic sense?
    Each country’s tariff rate was based on the U.S. trade deficit with that country, divided by the value of that country’s exports to the U.S. This cannot be considered to be reciprocal tariff; a country can run a trade deficit with another country that has zero tariffs and no other trade restrictions. Trade deficits often occur due to comparative advantage rather than unfair practices.
  18. How do tariffs affect American consumers?
    The tariffs amount to an average tax increase of nearly $1,200 per US household in 2025. An April 2019 University of Chicago study found that after tariffs on washing machines, washer prices increased by $86 per unit and dryer prices increased by $92 per unit, ultimately resulting in an aggregate increase in consumer costs of over $1.5 billion.
  19. What countries does the U.S. have trade surpluses with?
    While the U.S. runs overall trade deficits with most major partners, it has trade surpluses with some countries, particularly in services. The Netherlands is one example where the U.S. exports significantly more than it imports. The U.S. also tends to have surpluses in agricultural exports with many countries.
  20. How might trade relationships change in the future?
    As of the first quarter of 2025, the total US trade volume reached $2.61 trillion. Total Projected U.S. Trade Volume in 2025: ~$8.0 trillion. Future changes will likely be influenced by technological developments, climate policies, geopolitical tensions, and evolving supply chain strategies. The 2026 USMCA review will be particularly important for North American trade relationships.
Scroll to Top