Are you looking to expand your business into the Canadian market? Or perhaps you’re a Canadian company wondering where the biggest opportunities lie for your exports? Understanding Canada’s trading relationships can unlock massive potential for your import/export business. Remember that if you’ve found your market in the United States, you need to obtain U.S. import license.
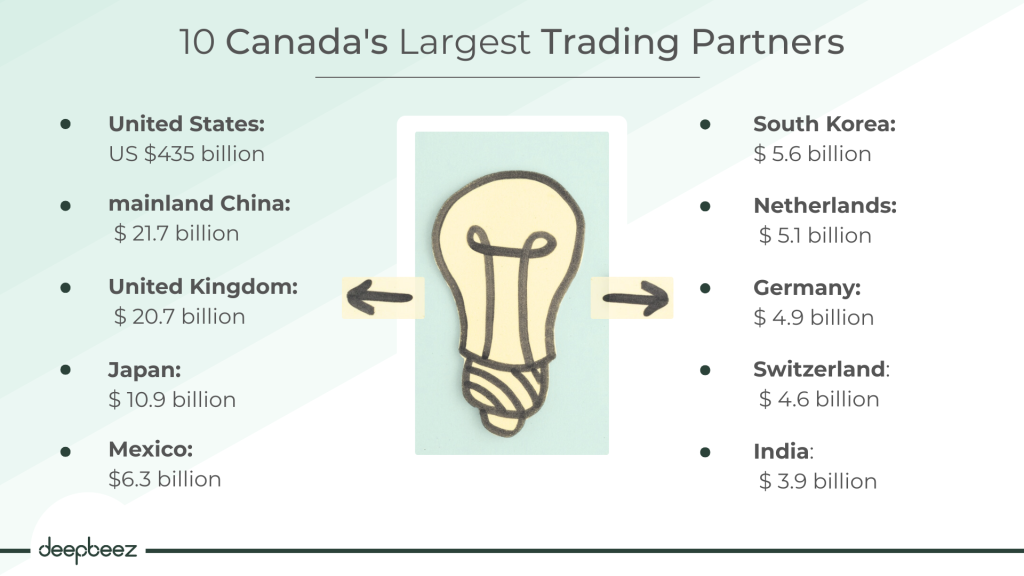
Canada’s largest trade partners are:
- United States: US$435 billion
- mainland China: $21.7 billion
- United Kingdom: $20.7 billion
- Japan: $10.9 billion
- Mexico: $6.3 billion
- South Korea: $5.6 billion
- Netherlands: $5.1 billion
- Germany: $4.9 billion
- Switzerland: $4.6 billion
- India: $3.9 billion
Who Are Canada’s Top Merchandise Export Partners?
Canada exported over $568 billion worth of goods in 2024. That’s not pocket change – that’s serious business opportunity. But here’s the fascinating part: just 15 countries captured 93.5% of all Canadian exports. What does this tell us about market concentration and opportunity? If you choose United States as your target country, you need to calculate your duty from Canada to U.S.
| Rank | Country | Export Value | % of Total Exports | Products |
| 1 | United States | $435 billion | 76.5% | vehicles, oil, machinery and wood |
| 2 | China | $21.7 billion | 3.8% | Wood pulp, mineral fuels, ores, cereals and machinery |
| 3 | United Kingdom | $20.7 billion | 3.6% | Gold, aircraft, machinery and mineral fuels |
| 4 | Japan | $10.9 billion | 1.9% | Mineral fuels, cereals (wheat), ores and wood products |
| 5 | Mexico | $6.3 billion | 1.1% | Vehicles, machinery, electrical equipment, plastics and mineral fuels |
| 6 | South Korea | $5.6 billion | 1.0% | Mineral fuel, oil, mineral ores, meat and wood pulp |
| 7 | Netherlands | $5.1 billion | 0.9% | Mineral fuel, oil, metal and non-metallic mineral products |
| 8 | Germany | $4.9 billion | 0.9% | Machinery, equipment, mineral fuels, oil, precious stones and metal |
| 9 | Switzerland | $4.6 billion | 0.8% | Gold, packaged medicaments, machinery and gas turbines |
| 10 | India | $3.9 billion | 0.7% | Mineral fuels, oil, vehicles, machinery and equipment, precious stones and metal |
| 11 | France | $3.2 billion | 0.6% | Aircraft, spacecraft, iron ore and gas turbines |
| 12 | Belgium | $2.72 billion | 0.5% | Diamonds, iron ore and packaged medicaments |
| 13 | Hong Kong | $2.7 billion | 0.5% | Gold, precious stones, metals, scrap aluminum, gas turbines and fish |
| 14 | Italy | $2.4 billion | 0.4% | Cereals, pharmaceutical products, machinery and aircraft |
| 15 | Australia | $2.3 billion | 0.4% | Machinery, precious metals and vehicles |
Discover more: Documents Required for Customs Clearance in Canada
Have you ever wondered which continents offer the best opportunities for Canadian exporters? The regional breakdown reveals some eye-opening insights:
| Region | Share of Total Exports | Strategic Importance |
| North America | 77.6% | Dominant market due to proximity and trade agreements |
| Asia | 10.6% | Fast-growing economies with increasing demand |
| Europe | 9.2% | Established markets with high purchasing power |
| Latin America* | 1.4% | Emerging opportunities (*excluding Mexico) |
| Africa | 0.7% | Untapped potential with growing economies |
| Oceania | 0.5% | Niche markets led by Australia and New Zealand |
Notice anything interesting? North America captures more than three-quarters of Canada’s exports, but Asia and Europe together represent nearly 20% – that’s substantial business worth pursuing.
Who Are Canada’s Top Import Partners?
While exports tell one story, imports reveal another crucial dimension of Canada’s trade relationships. Smart businesses understand both sides of the equation.
Canada sources goods from strategic partners worldwide, creating opportunities for international suppliers:
| Country | Import Value ($ billions) | Percentage of Total Imports | Products |
| United States | $ 317 | 49 % | Machinery, vehicles, mineral fuels and plastic |
| China | $ 63 | 10 % | Machinery, electronics, plastics, toys and textiles |
| Mexico | $ 36 | 6 % | vehicles, machinery, pharmaceuticals and medical devices |
| Germany | $ 19 | 3 % | Vehicles, machinery, pharmaceuticals and medical devices |
| Japan | $ 15 | 2.5 % | Vehicles, machinery, electronic equipment and optical/medical instruments |
The Trade Balance Reality: Where Opportunities Hide
Here’s where it gets interesting for your business strategy. Canada’s trade balance varies dramatically by partner, revealing both challenges and opportunities.
| Country | Trade Surplus | Growth from 2023 | Opportunity Level |
| United States | $160.6 billion | +27.4% | Massive, stable |
| United Kingdom | $13.7 billion | +290.8% | Explosive growth |
| Hong Kong | $2.5 billion | – | Gateway potential |
| Netherlands | $1.8 billion | – | European access |
| UAE | $1.3 billion | +38.8% | Middle East hub |
Notice that 290.8% growth with the UK? That’s not a typo—that’s an opportunity explosion waiting for the right business to capitalize on it.
Canada’s Trade Deficit Partners (2024)
Understanding where Canada runs deficits reveals import opportunities:
| Country | Trade Deficit | Primary Import Categories | Your Opportunity |
| China | -$42.3 billion | Machinery, electronics, textiles | Can you compete on quality/speed? |
| Mexico | -$28.0 billion | Vehicles, machinery | USMCA advantages available |
| Germany | -$12.2 billion | Vehicles, pharmaceuticals | Premium market entry |
| Vietnam | -$9.9 billion | Manufacturing goods | Cost competition |
| South Korea | -$6.7 billion | Automotive, electronics | Tech integration |
Strategic Questions for your Business
Understanding these trading relationships is just the beginning. The real question is: How will you leverage this information to grow your business?
Consider These Strategic Questions:
- Which of Canada’s top trading partners align with your business goals?
- Are there underserved markets where you could establish a strong position?
- How can you tap into the massive U.S.-Canada trade corridor?
- What opportunities exist in Canada’s growing relationships with Asian markets?